Walkthrough · No. 03
District Dashboards: Public data, joined district by district
How 54 Dataful datasets became three dashboards on India’s districts: maps and charts that state their caveats, and an Ask box that shows its SQL.

§ 01 Problem
The problem
Is the job guarantee reaching districts whose harvest failed? Do two records of child growth agree? Do deposits come back as loans? The data exists, spread across separate releases, and answering meant stitching it together by hand, district by district.
§ 02 Information and data
What made it hard
-
District boundaries change: every series is keyed on the official district code and re-based after a split.
-
Series break: banks leave a dataset, a survey covers a different age band, a scheme changes its rules.
-
Two records of the same thing disagree, such as the Poshan Tracker and NFHS-6 on stunting.
-
Missing data must read as missing, never as zero.
§ 03 Workflow and design
The decisions that shaped it
D1
One stack, three dashboards
A shared data layer, map package and design system; a new theme starts from a template.
D2
Compare each district with itself
A harvest is measured against the district’s own five-year average, so a dry district is not penalised for being dry.
D3
Every chart says how to read it
What it shows, how to read it and what it cannot tell you, with period, n and caveat.
D4
Reviewed answers first, live AI second
Known questions run reviewed SQL; anything else goes to GoPie, labelled exploratory.
D5
Figures, not datasets
No bulk export or data API; every source links to its page on Dataful.
§ 04 Shipped, not planned
What it actually does
- District maps for 700+ districts, missing data hatched and boundary changes flagged
- District profiles, rankings, regional comparisons and correlation tables
- Ask in plain words: reviewed answers with chart, caveat and SQL; open questions to GoPie
- Official notes on charts, linked to the official document through Tagore AI
- Runs standalone on embedded DuckDB, or on GoPie with the same SQL
§ 05 Input → steps → output
Walkthrough
-
Input
54 Dataful datasets, from crop yields and rural job-guarantee work to the Poshan Tracker, NFHS, bank credit, UPI and exports, joined on the district code.
-
Step 1: See the national picture
Rural Distress Radar opens on a harvest map: each district against its own five-year average, the deepest shortfalls beside it.
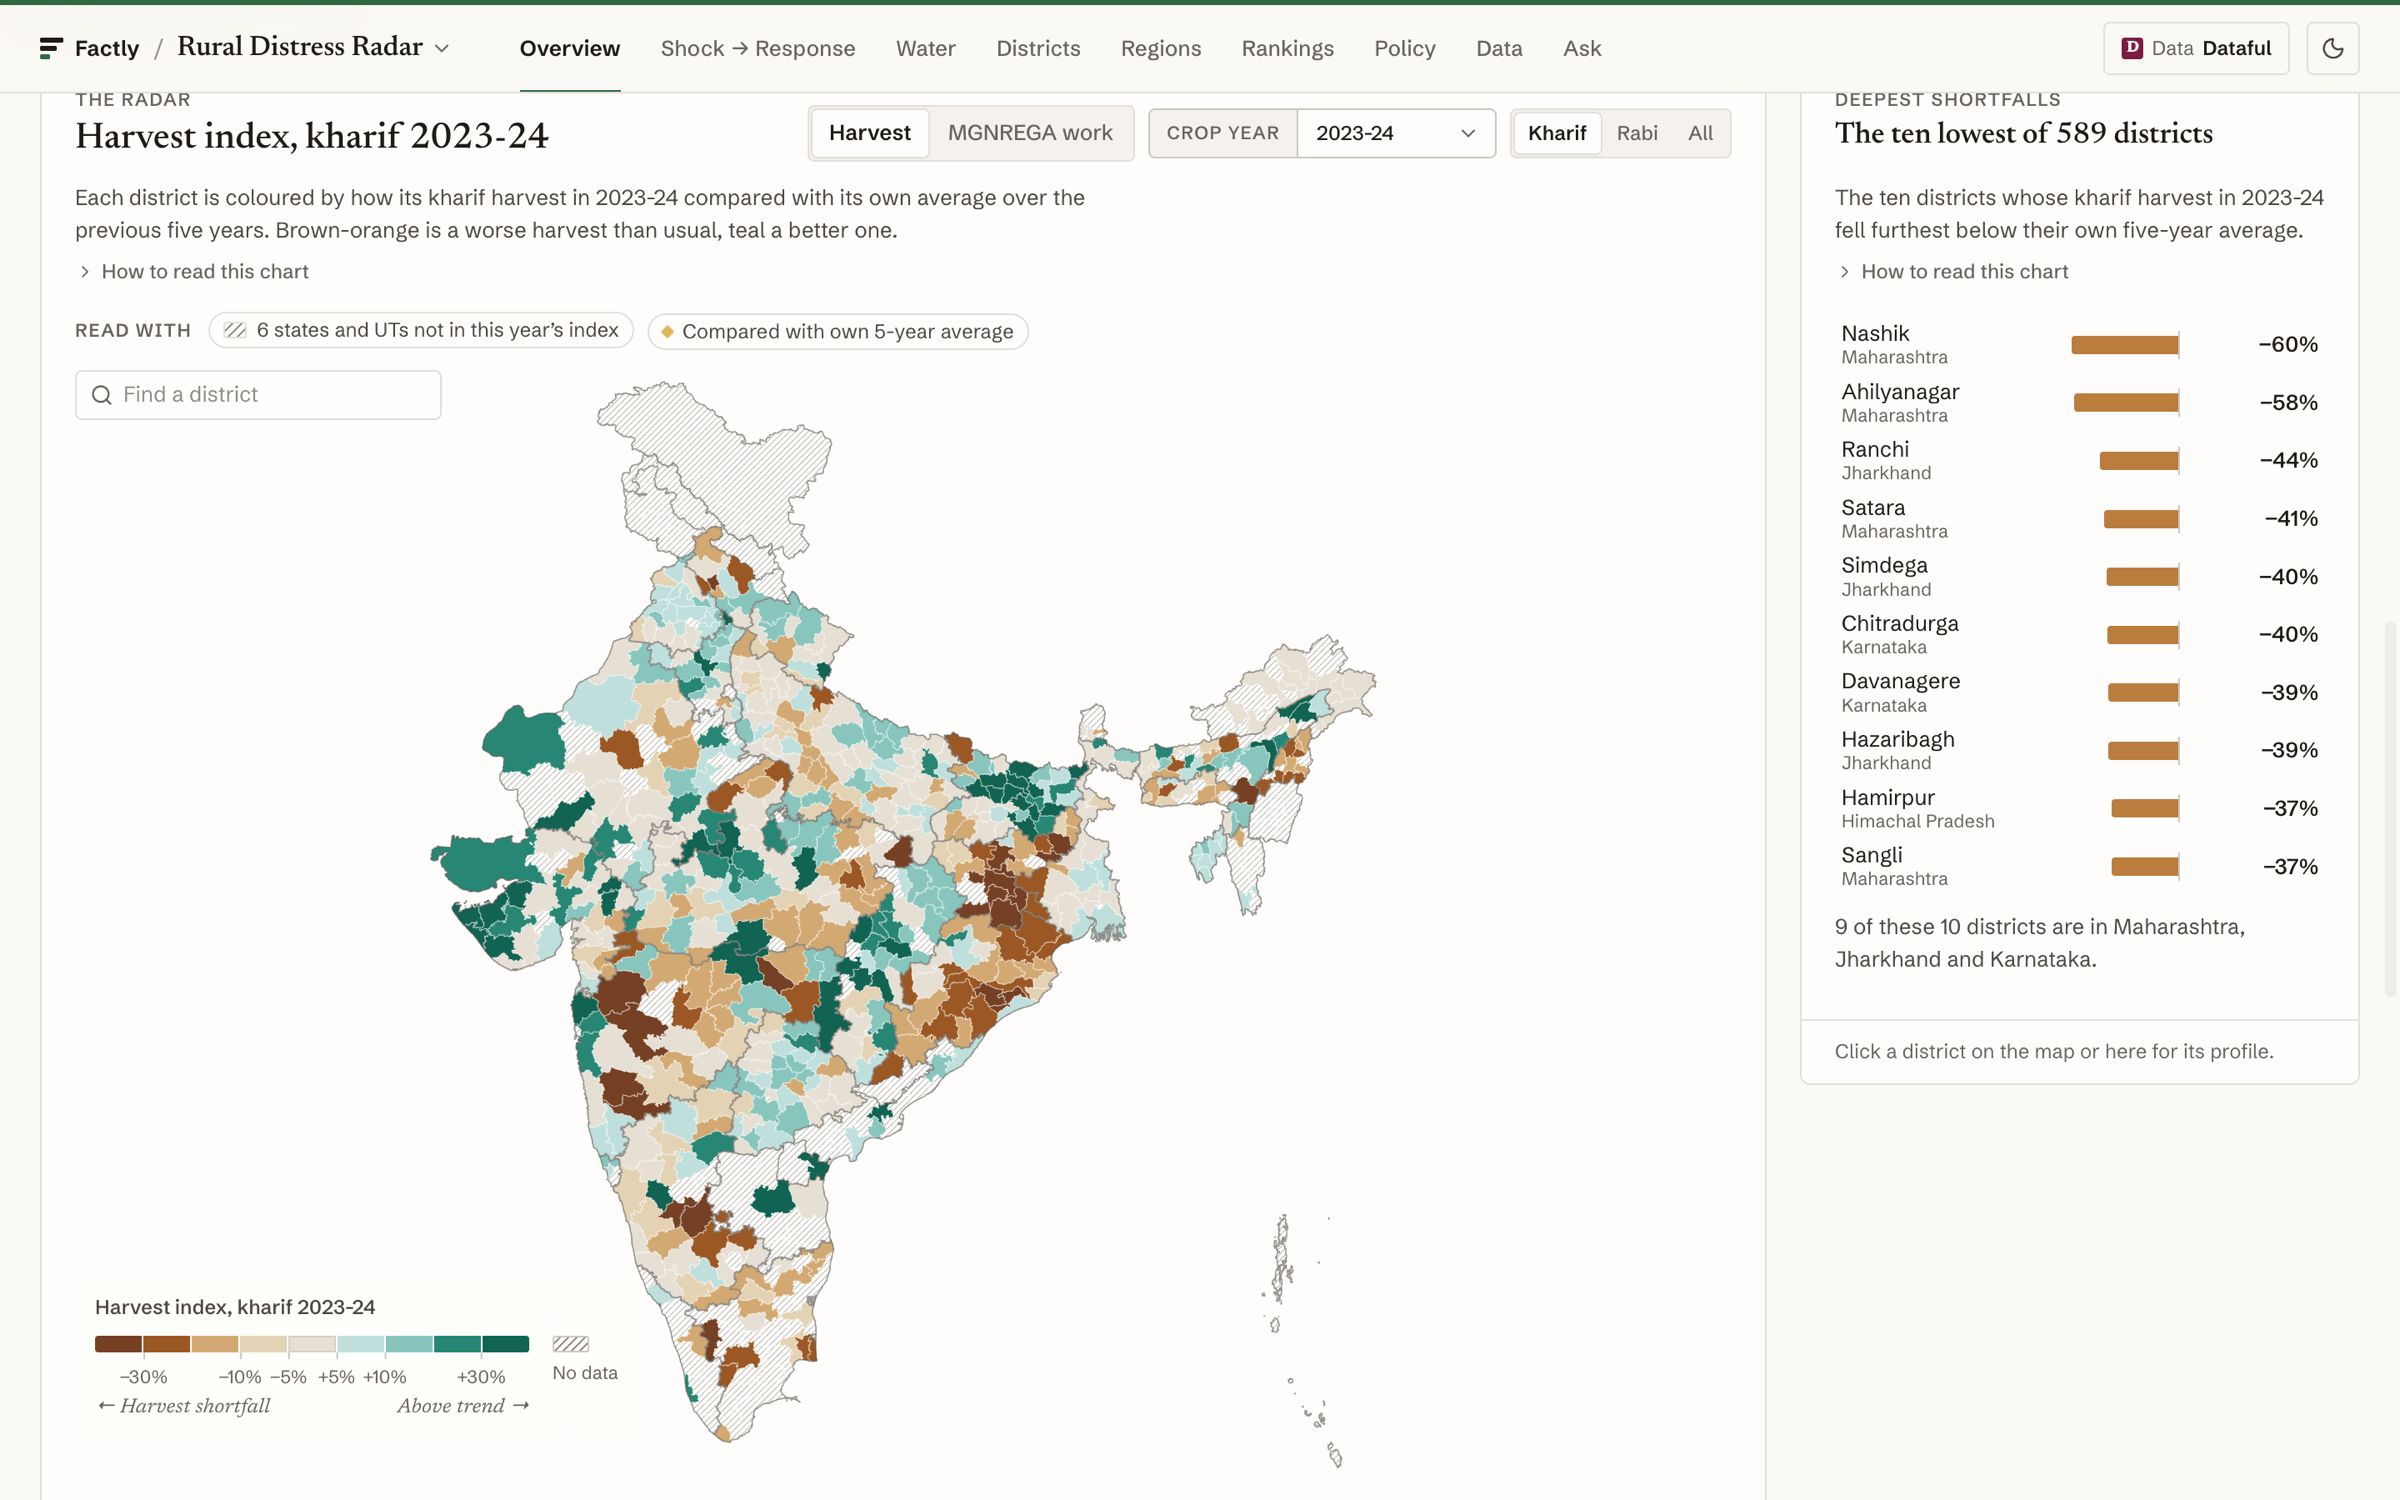
Fig. 2 The harvest radar. -
Step 2: Test the headline
Harvest shortfall against job-guarantee work, compared within each state. The chart states its correlation, its n and its caveats, with the Dataful sources beneath.
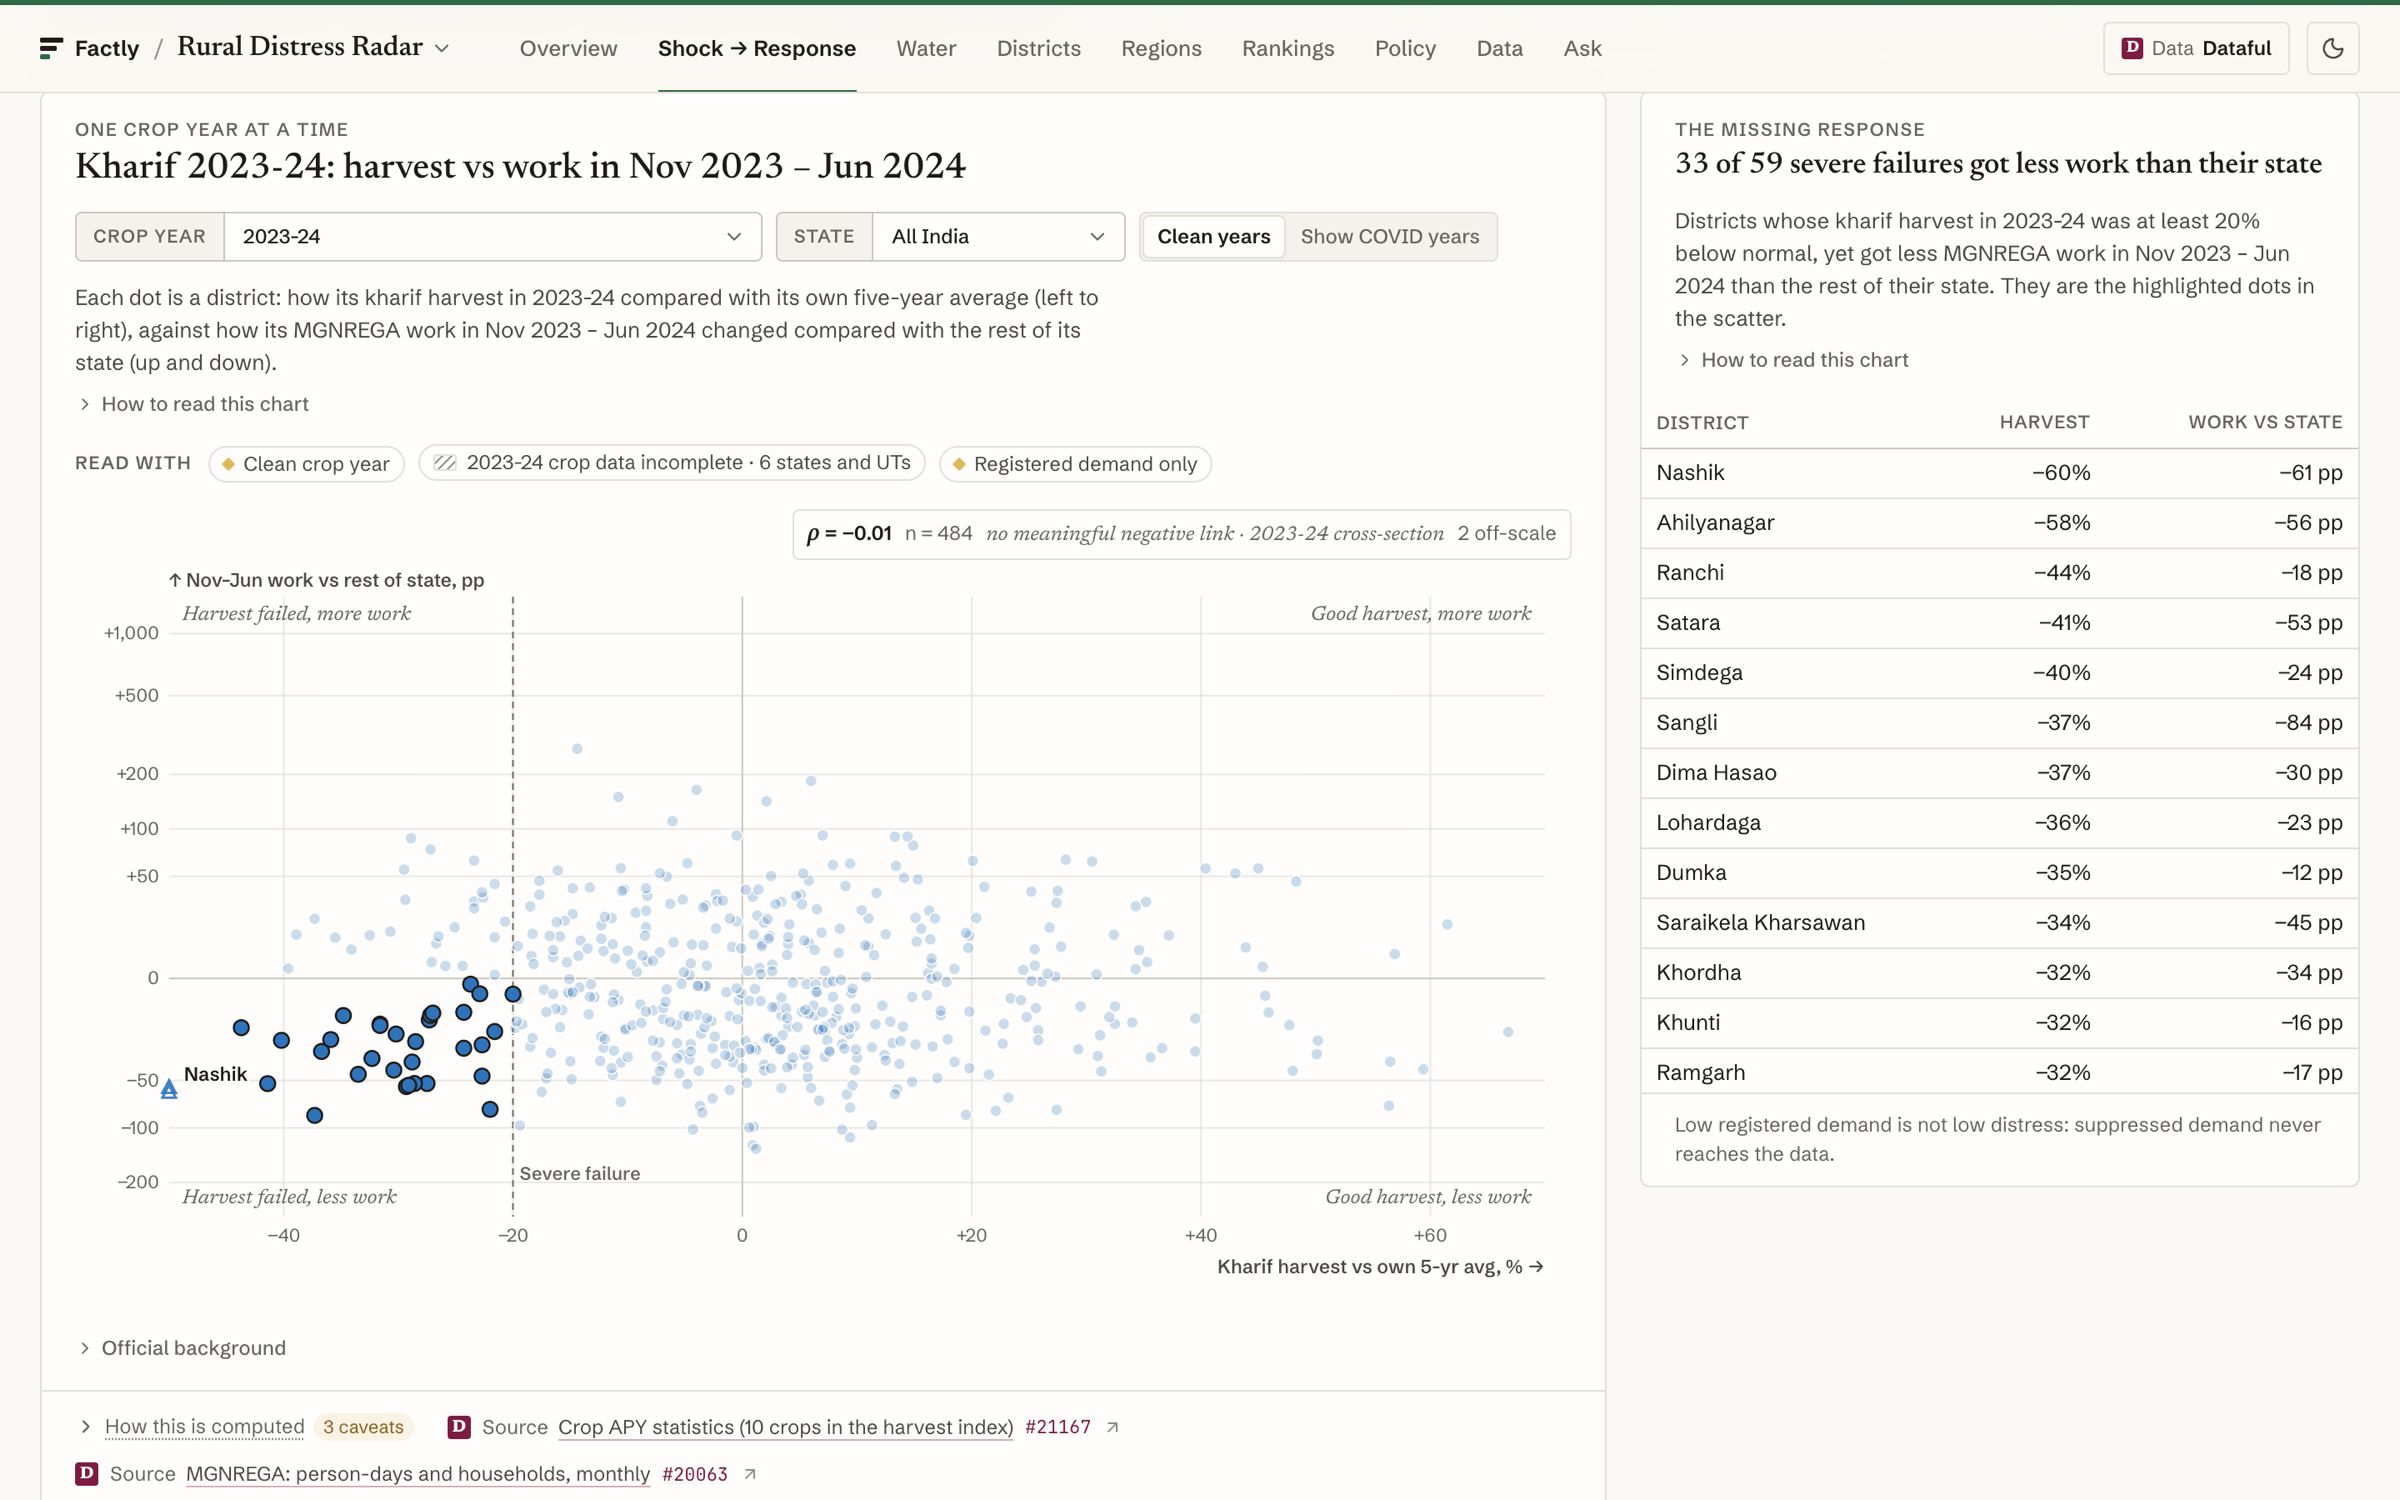
Fig. 3 One question, tested on every district. -
Step 3: Line up two records
The First 1,000 Days puts the Poshan Tracker beside NFHS-6 for every district: where they agree, and where they part ways.
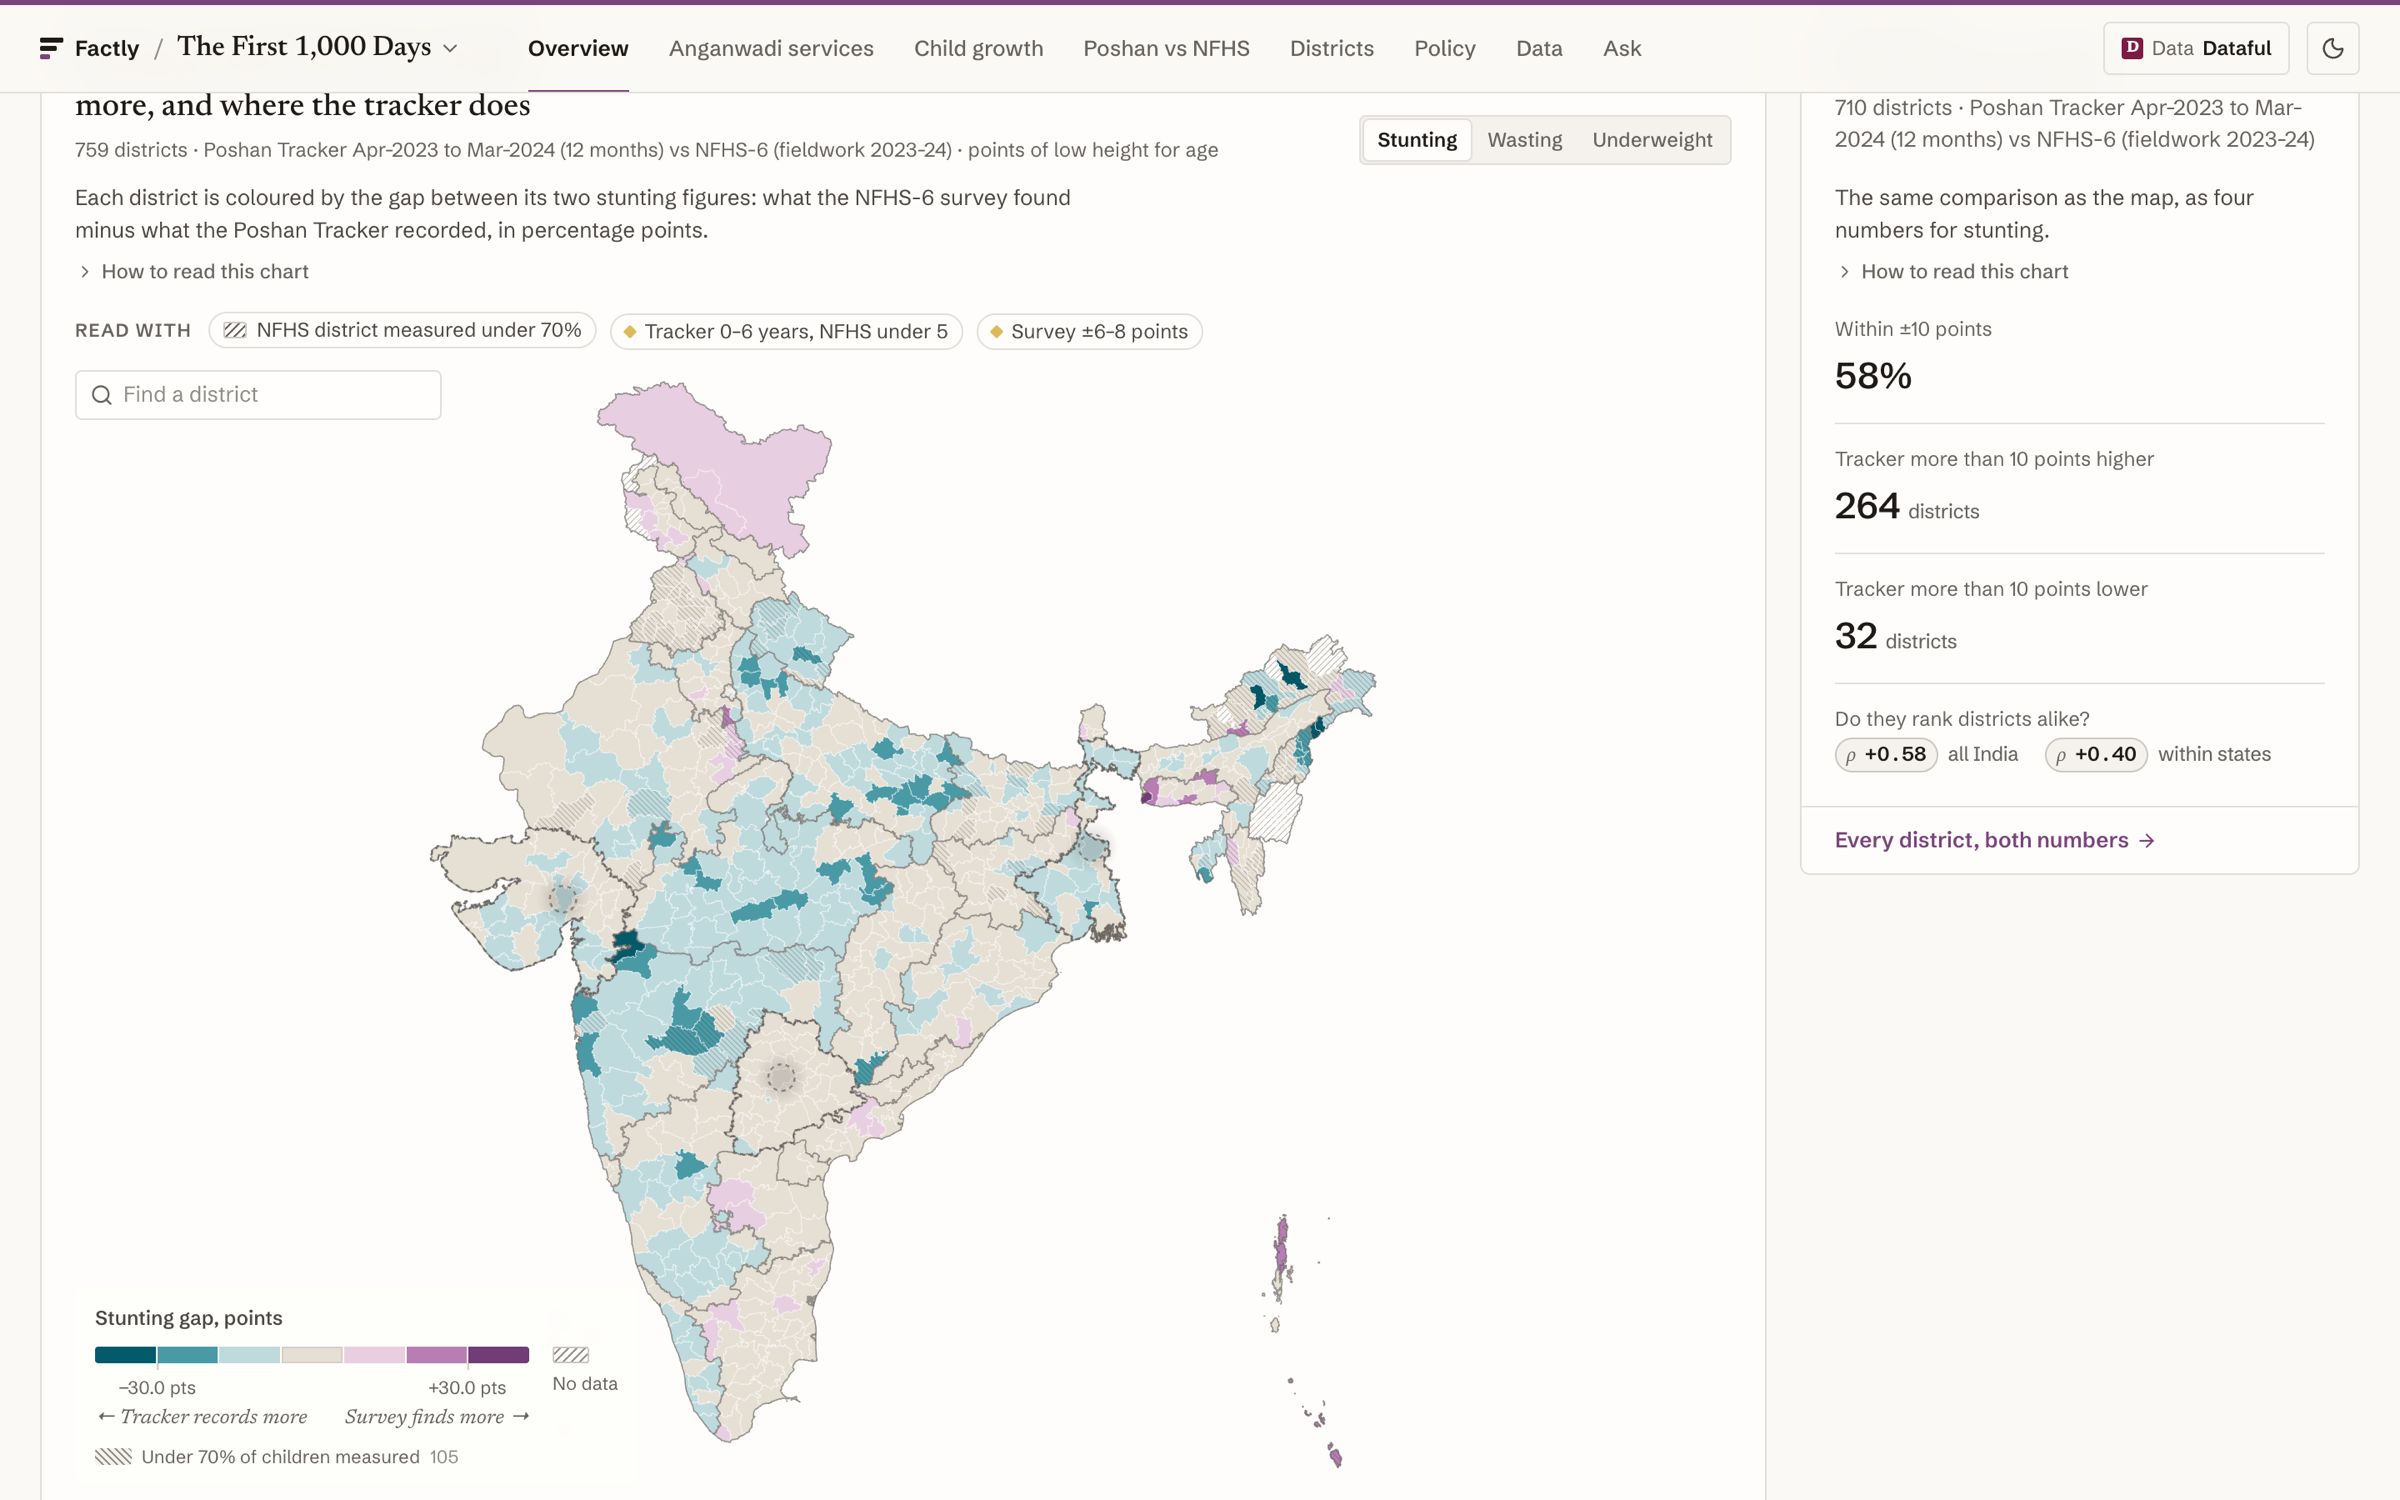
Fig. 4 Two records of the same children. -
Step 4: Follow the money
District Growth Engines tracks twenty years of deposits and credit by poverty tier, every series break labelled.
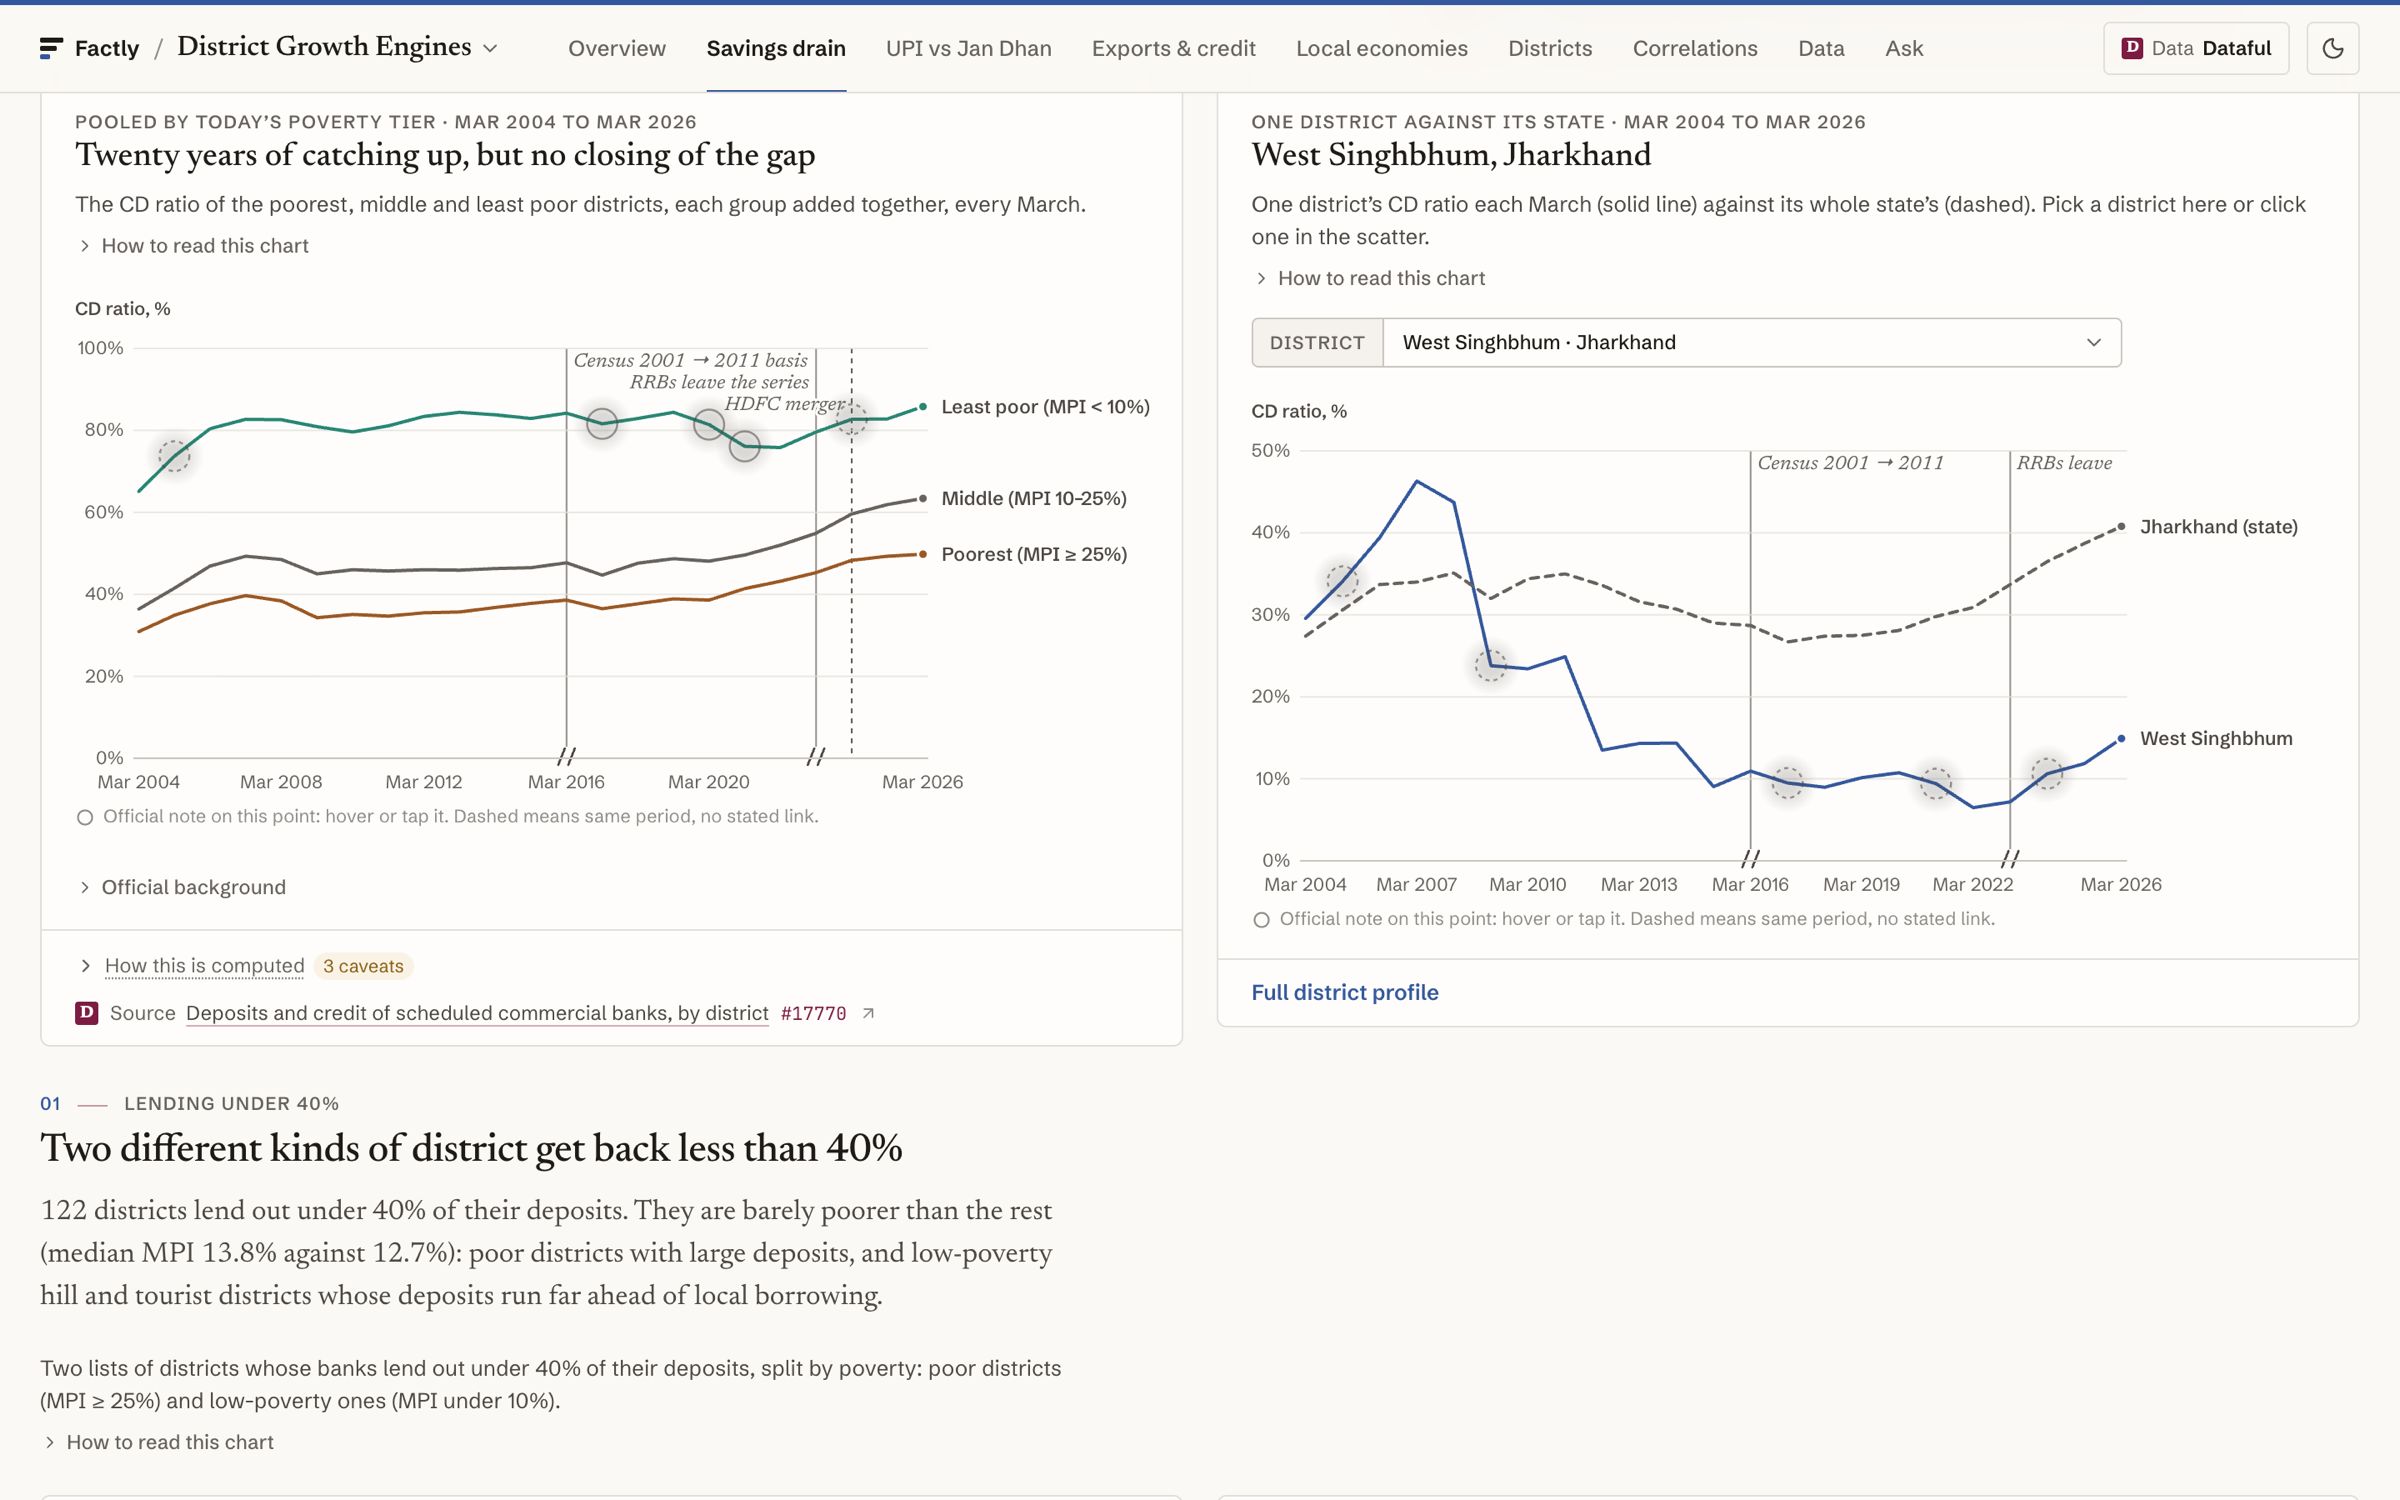
Fig. 5 Twenty years, breaks labelled. -
Step 5: Ask in plain words
A reviewed question returns a verified answer with its chart, period, n, caveat and SQL. Anything else goes to GoPie, marked exploratory.
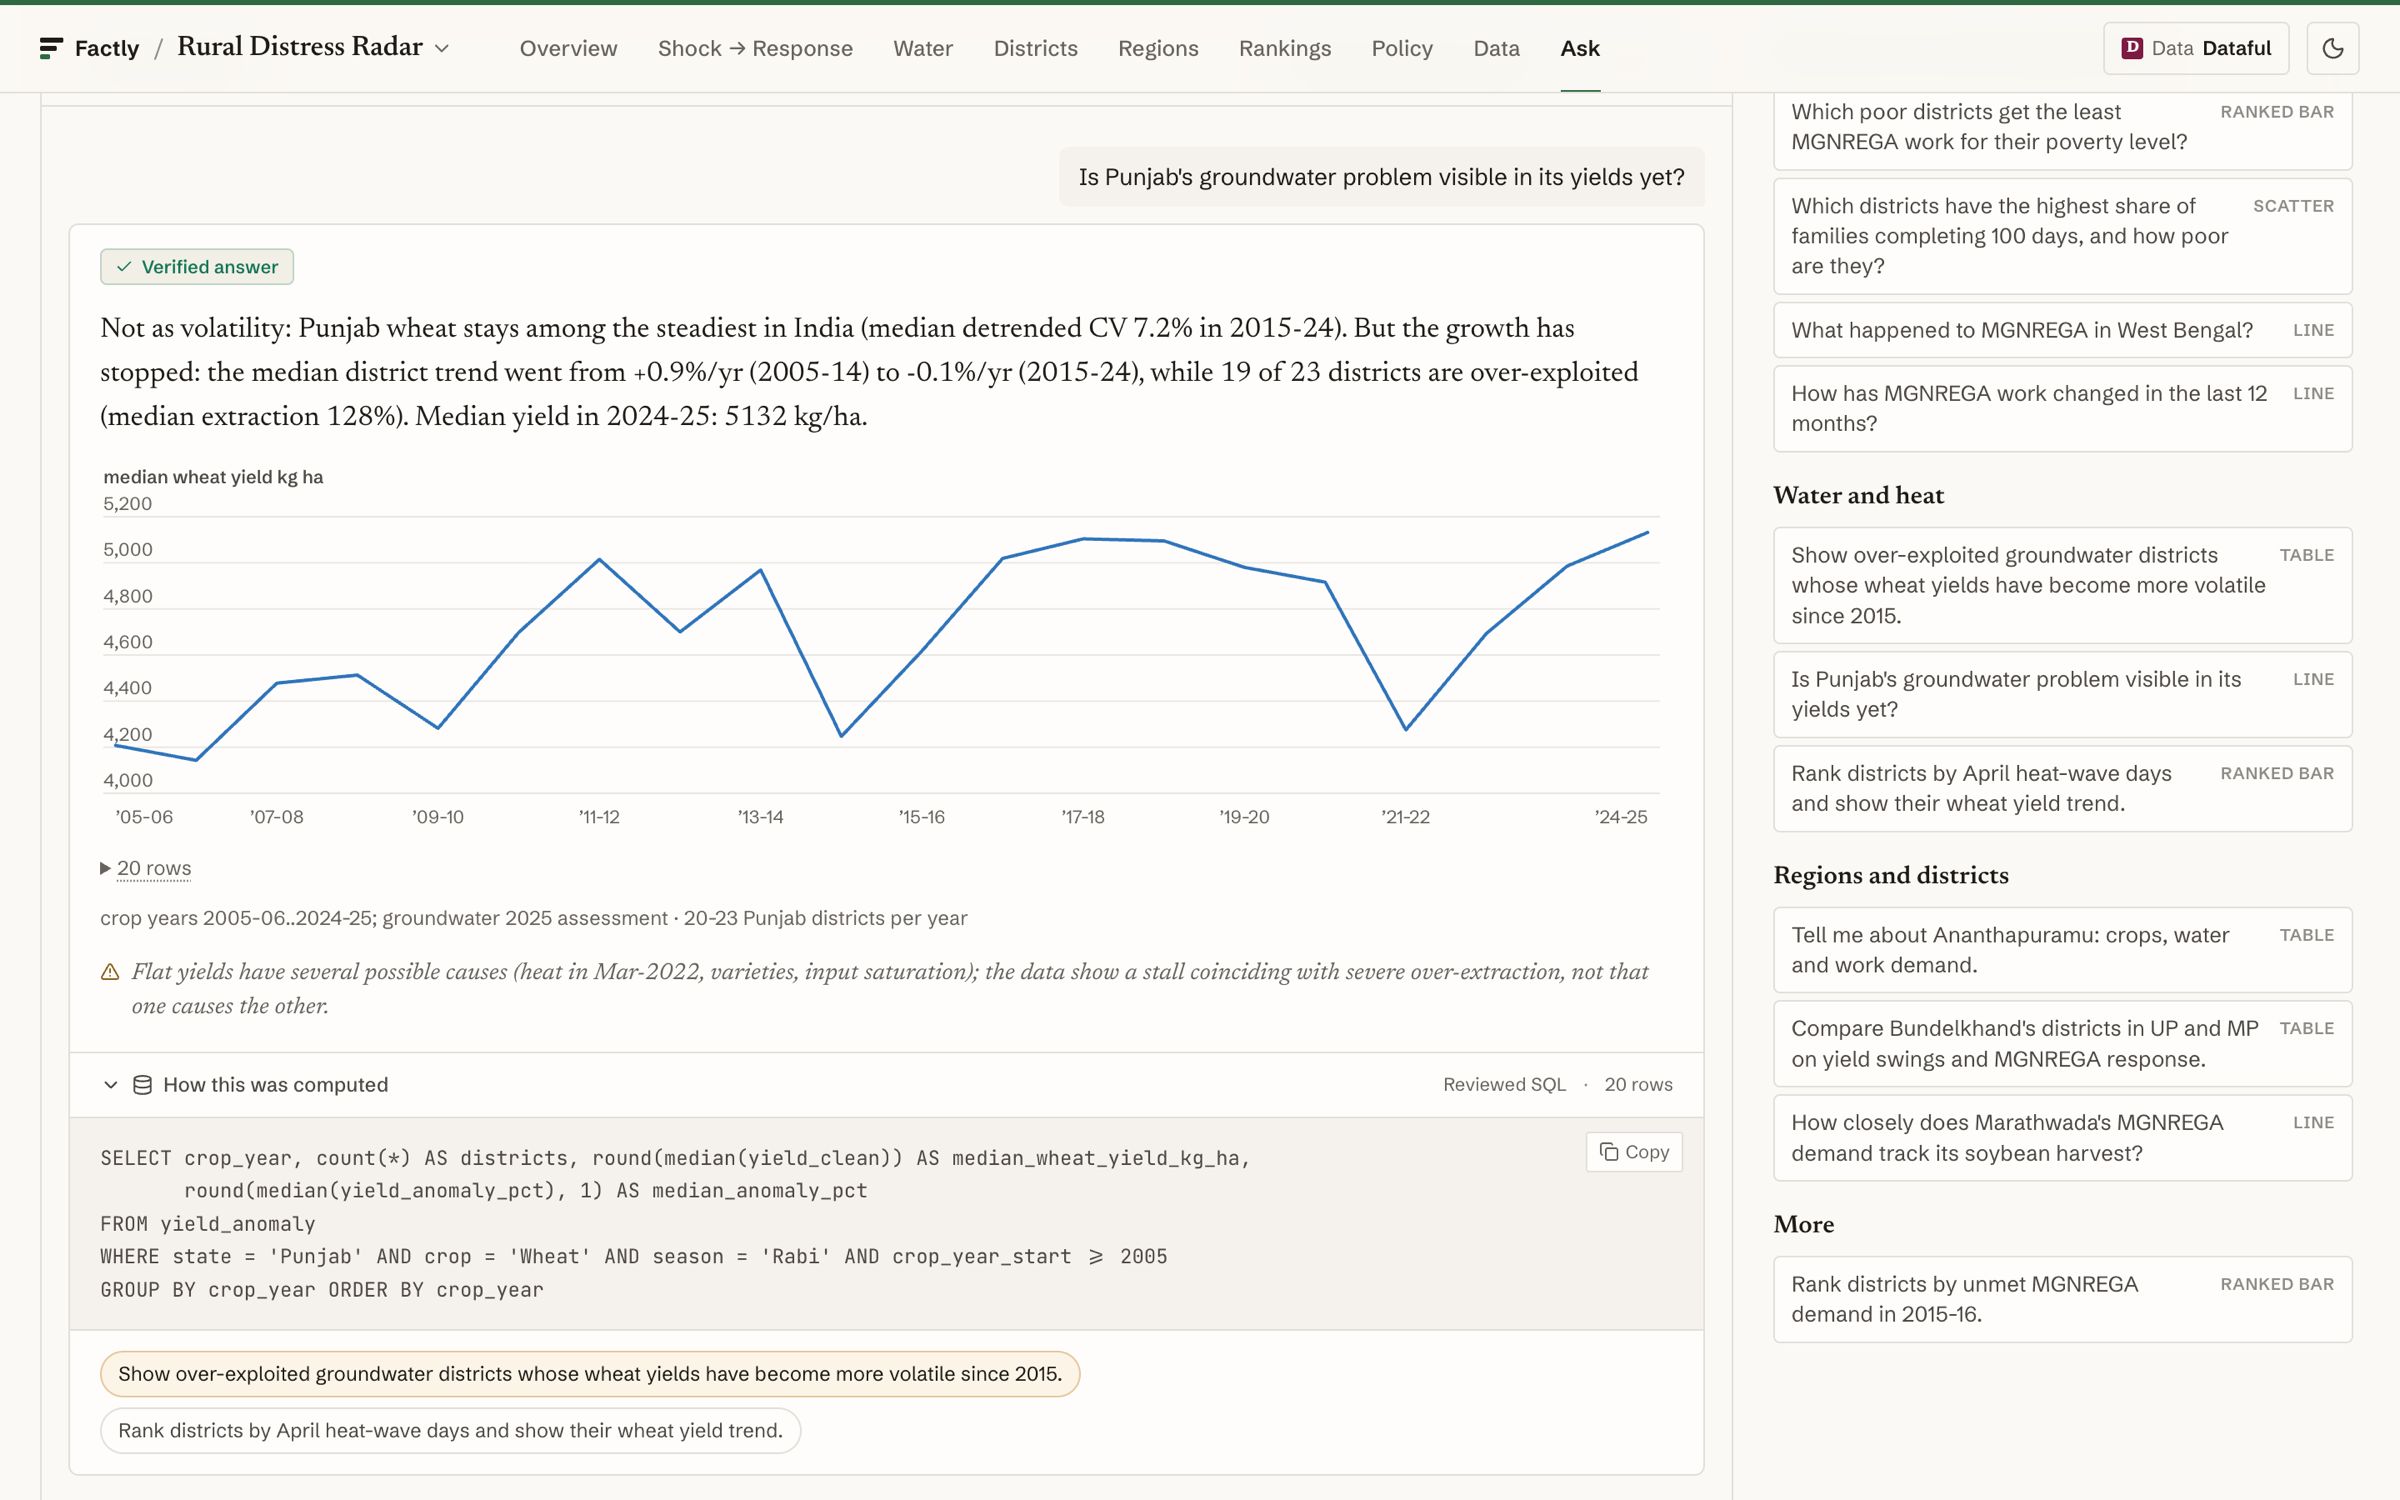
Fig. 6 A verified answer, SQL shown. -
Output
A district question answered in minutes, with the source, the method and the caveat on screen.


§ 06 Evaluation
How we check it
-
Every figure in the copy is computed from the data; no number is typed in by hand.
-
Reviewed answers never swap in another district or year: ask for a year with no data and you get the years that exist.
-
The same SQL runs on embedded DuckDB and on GoPie, and a parity check compares the two.
-
Null results are shown as nulls, and every chart separates association from cause.
§ 08 Limitations and lessons
Limitations and lessons
read this part first
Limitations
- Datasets arrive at different grains and dates; some comparisons are a single snapshot.
- District survey estimates carry a margin of several points, so small gaps read as agreement.
- The deployment is private; demos are on request.
Lessons from operation
- The join is the product: one district code turned separate releases into one analysis.
- Honest caveats earn trust faster than polish. A labelled null is a finding.
- Build the stack once. The second and third dashboards started from a template.
Sources (7)
- [1] District dashboards: dataset and question counts, provided by Factly (November 2026) · dataful.in (opens external site)
- [2] Dataful: district deposits and credit of scheduled commercial banks · dataful.in (opens external site)
- [3] Dataful: MGNREGA person-days and households by district, monthly · dataful.in (opens external site)
- [4] Dataful: Poshan Abhiyaan growth monitoring by district, monthly · dataful.in (opens external site)
- [5] Dataful: home · dataful.in (opens external site)
- [6] GoPie: home · gopie.ai (opens external site)
- [7] Tagore AI: home · tagore.ai (opens external site)
Sources reviewed 15 November 2026, 16 November 2026.
Discuss a project
Have data that should answer district questions?
Tell us the questions, the data you hold and who needs the answers. We build the dashboard around them.