Walkthrough · No. 02
GoPie: From a question to a checked report
How an AI data workspace turns tables and documents into answers, dashboards and reports, with the evidence attached. Shown on real CSR and BRSR filings.

§ 01 Problem
The problem
Numbers sit in spreadsheets, meaning sits in documents, and answers wait on whoever can write a query. Dashboards take a sprint and go stale; the monthly report is assembled by hand.
§ 02 Information and data
What made it hard
-
Tables with stray spaces, cryptic headers and a dozen spellings of the same place.
-
Codes without codebooks: state and district codes, scheme identifiers, abbreviations.
-
Context in documents that never reach the analysis.
-
Tables too large for a model to read; the system must query.
§ 03 Workflow and design
The decisions that shaped it
D1
Clean on the way in
Values and headers standardised on upload, code dictionaries applied (“US → United States”); the original untouched.
D2
Query, do not read
The agent reads the schemas, drafts SQL, runs and repairs it, and stops to explain if the data cannot answer.
D3
Evidence attached to every answer
Prose grounded in executed results; SQL, rows and document citations visible.
D4
Dashboards in one click, reports you approve
Dashboards generate from a dataset and are edited by chat; reports are approved before sharing.
D5
Open core, your choice of hosting
AGPL-3.0 core, self-hostable (Docker, Helm); the model provider is a configuration choice.
§ 04 Shipped, not planned
What it actually does
- Upload CSV, Excel, Parquet or JSON, or connect PostgreSQL, MySQL, Snowflake, MotherDuck or Amazon S3
- PDF, DOCX and notes as context documents beside the data
- Answers with SQL, rows and document citations visible
- Dashboards from a prompt, edited by chat; reports approved before sharing
- Versioned REST API and SQL playground per dataset; MCP server; Slack, Teams and Google Chat bots
§ 05 Input → steps → output
Walkthrough
-
Input
Standardised datasets (a decade of Indian CSR filings from Dataful) and, for BRSR, the filing documents themselves.
-
Step 1: Ask a question
“What was the CSR expenditure in each state of Northeast India in 2024-25?” The agent plans and runs the query, step by step.
-
Step 2: Check the working
The generated SQL sits above the answer: the filter and grouping are there to check.
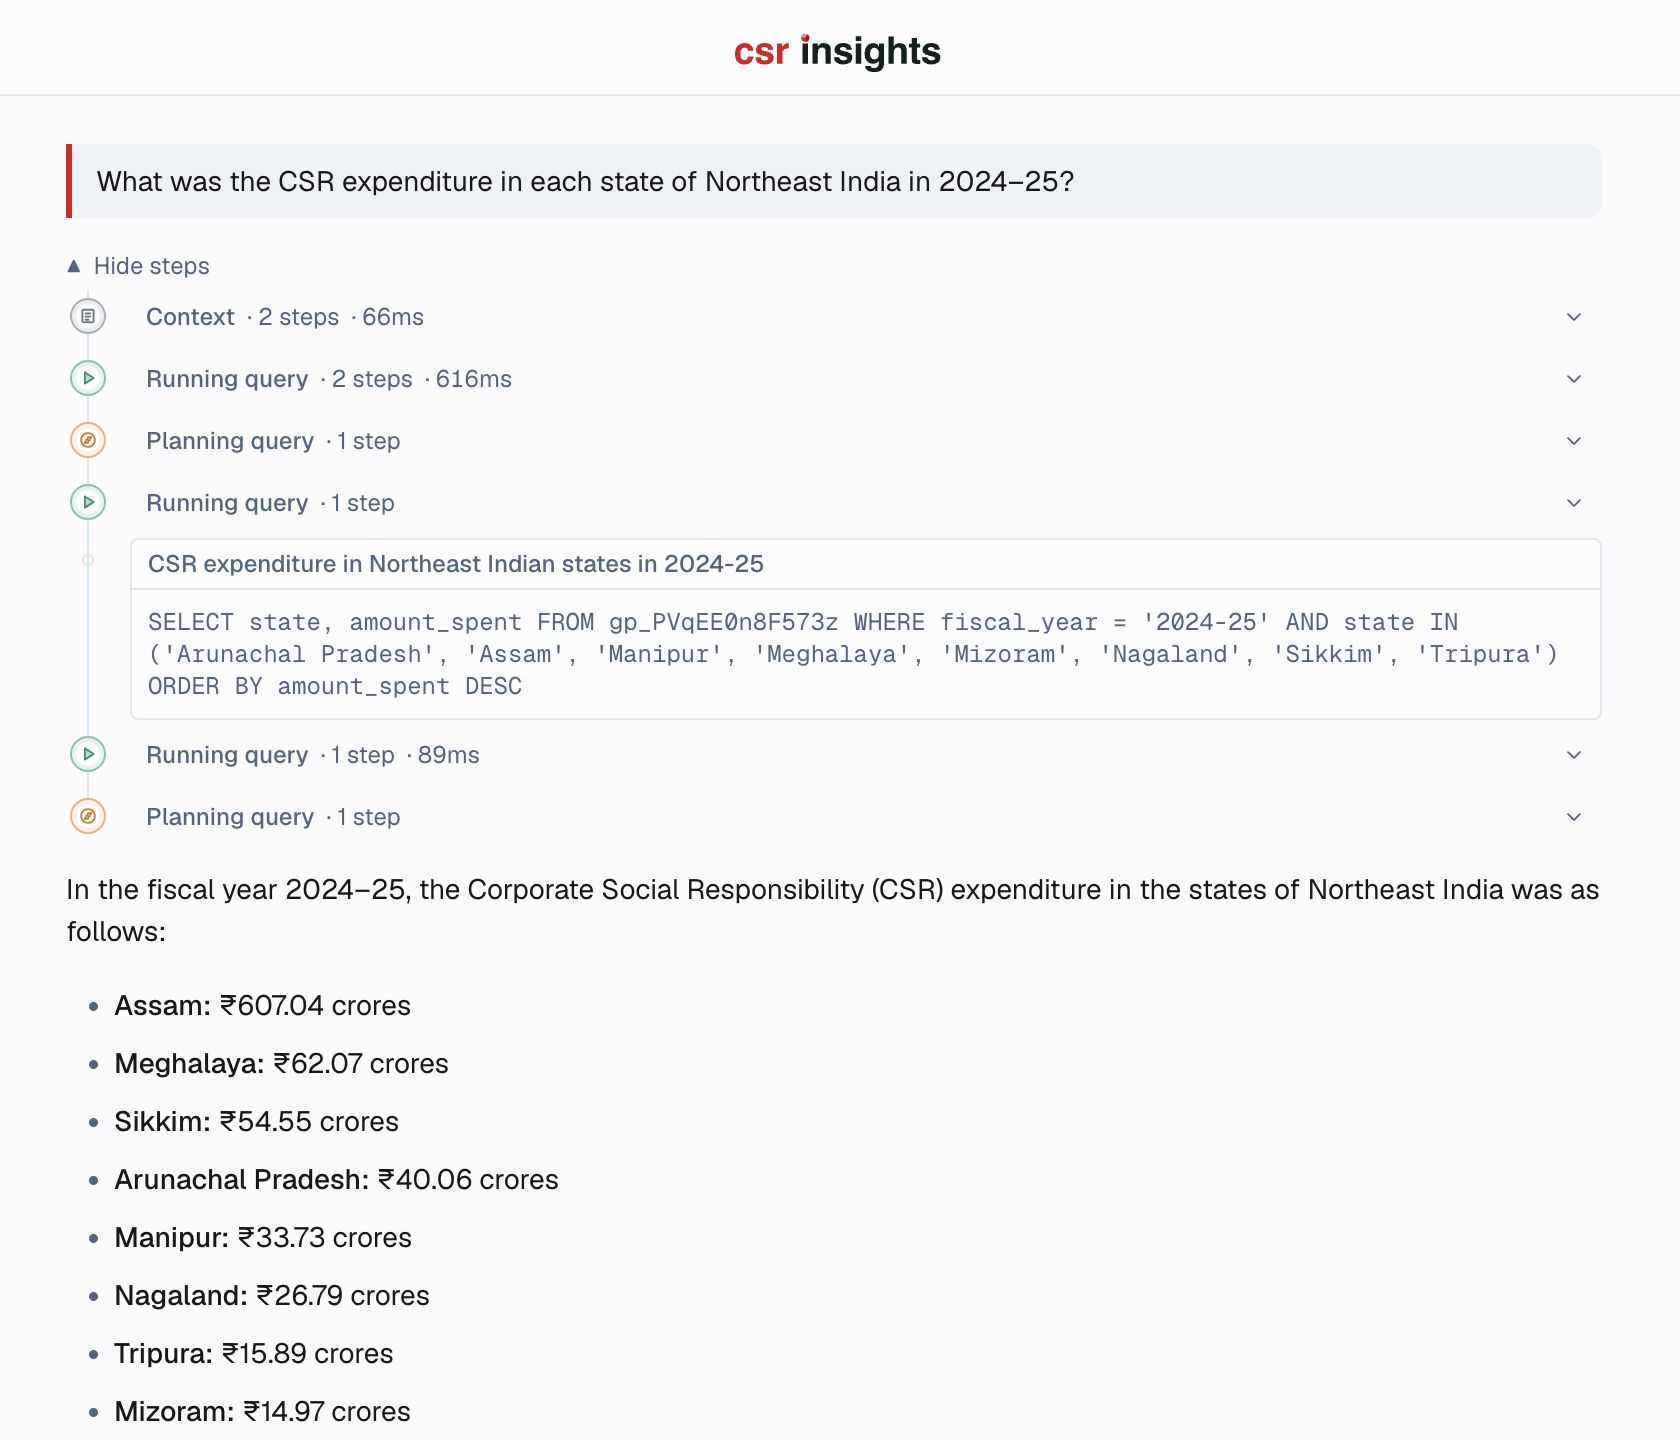
Fig. 2 Steps, SQL and answer in one view. -
Step 3: Bring in the documents
In BRSR Insights the same engine answers from the data, then the filings, citing the PDFs.
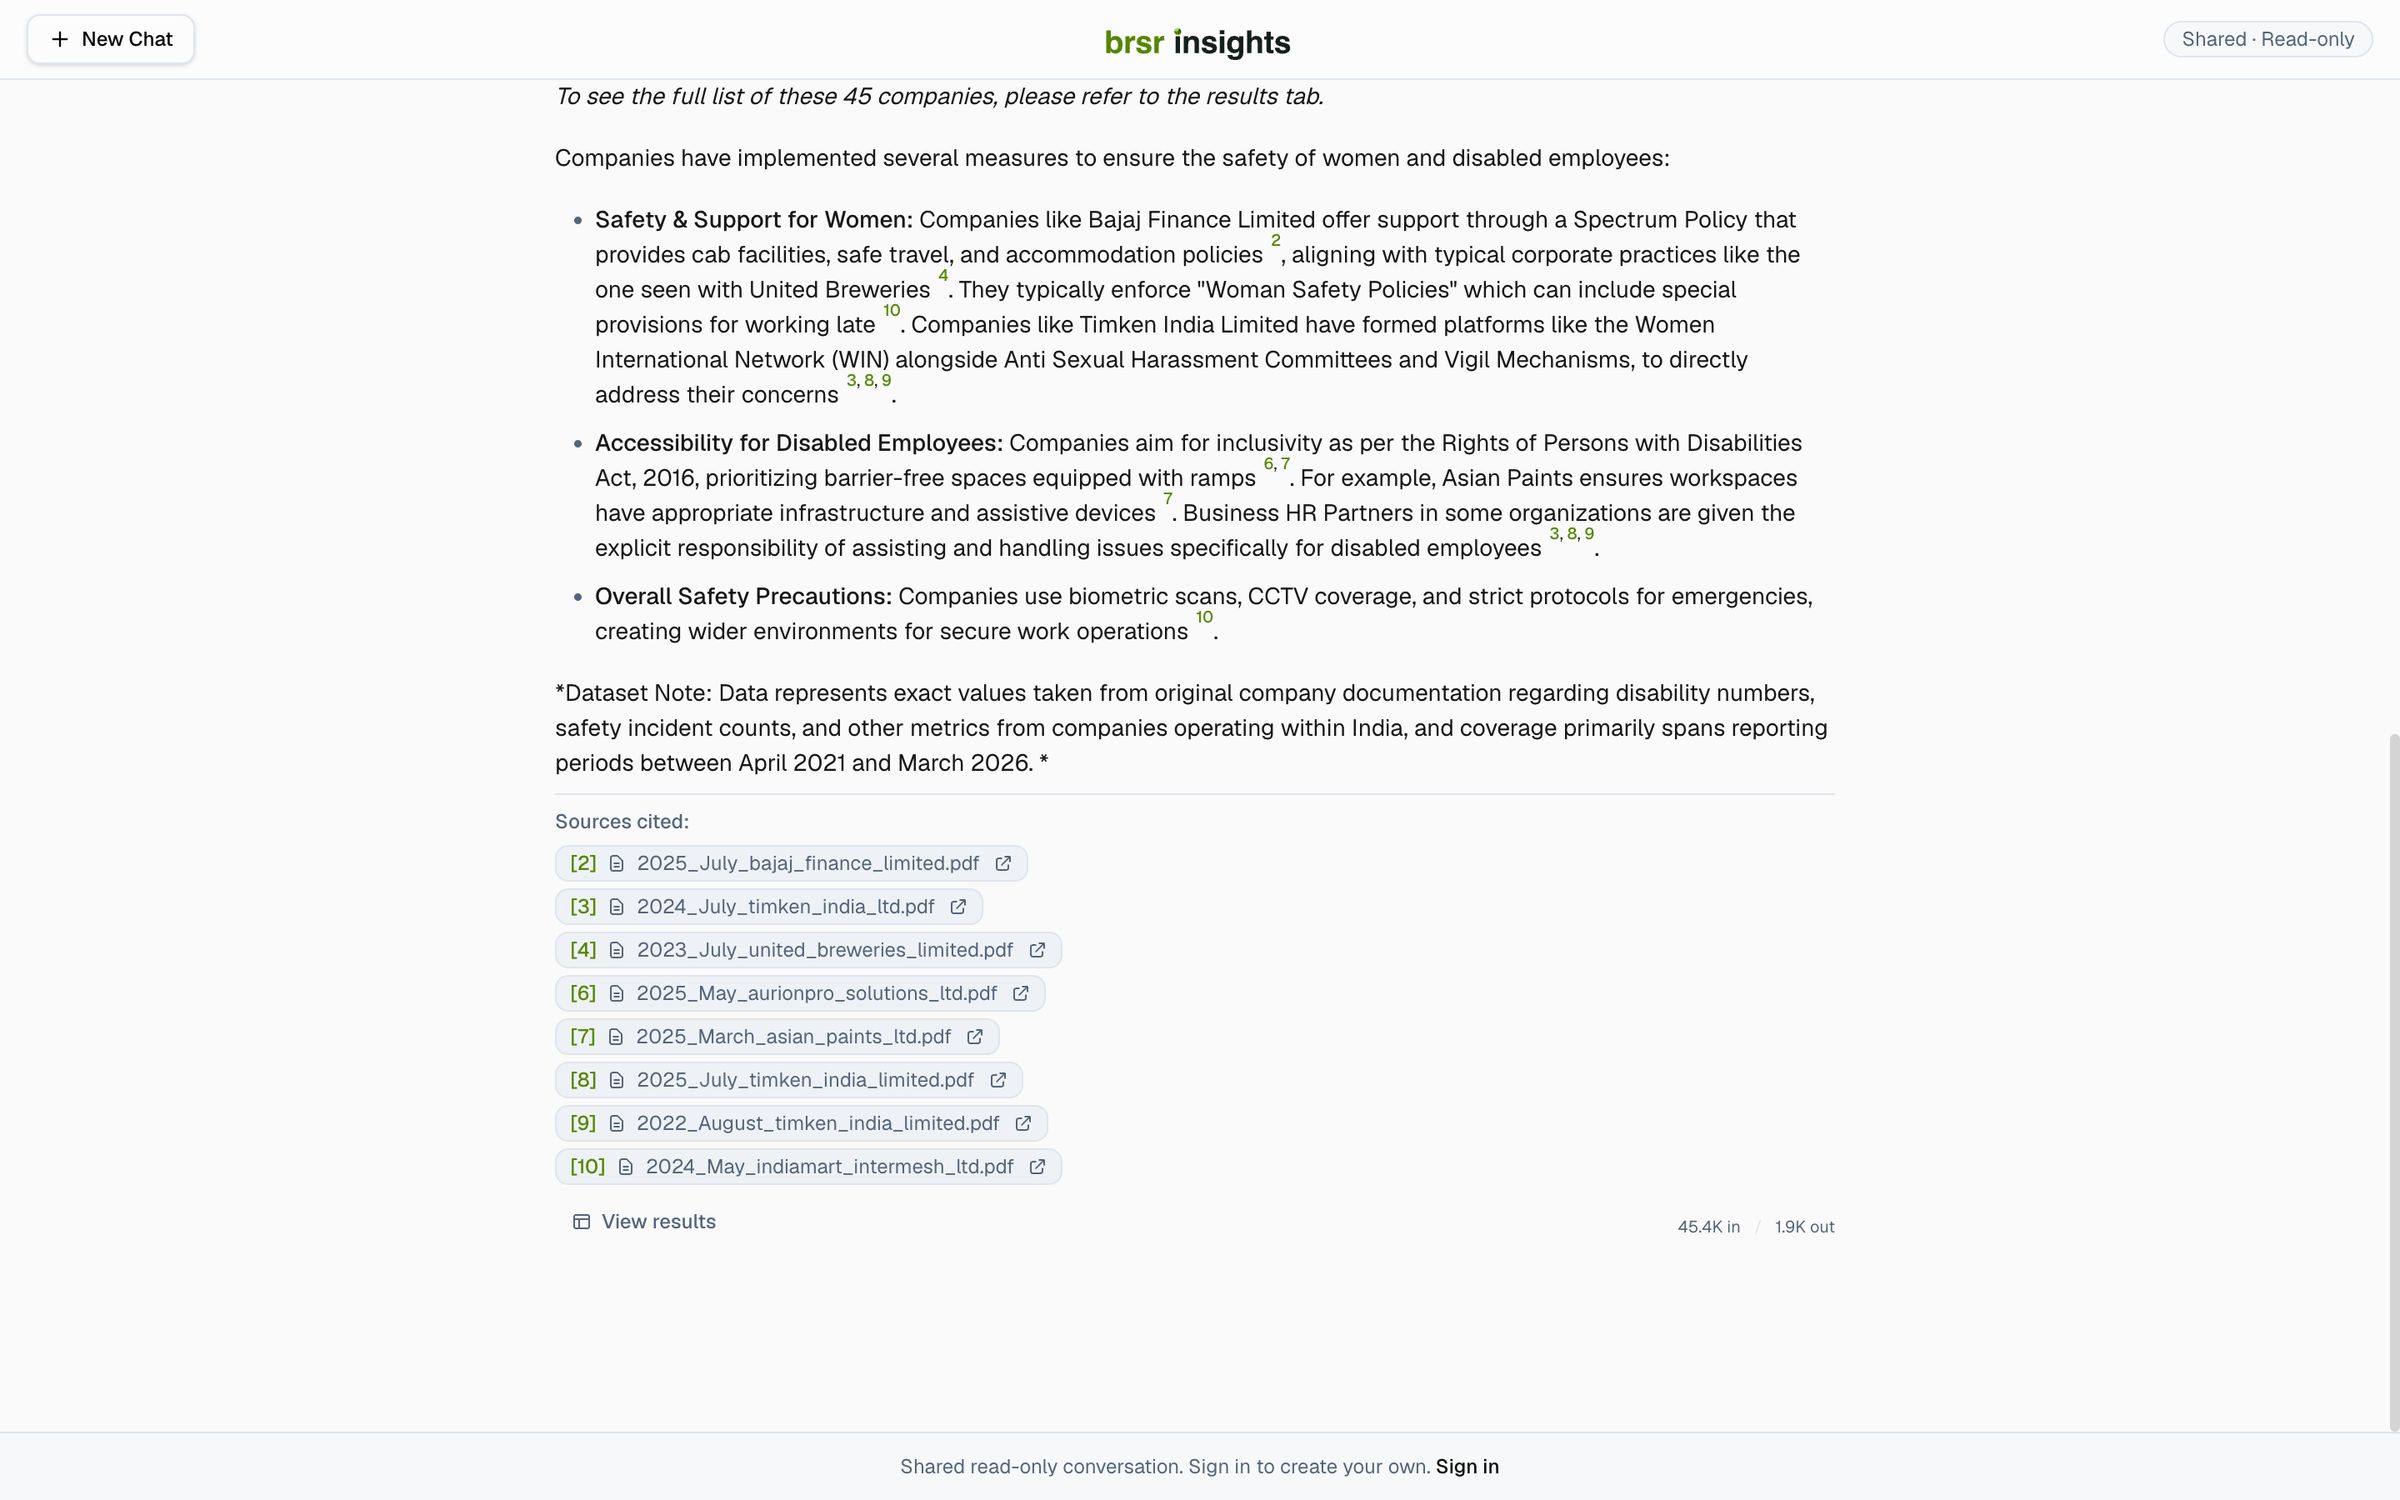
Fig. 3 Structured data and documents in one cited answer (BRSR Insights). -
Step 4: Build a dashboard from a prompt
“CSR spending across states over the years” becomes KPI tiles, a top-states list and a sector chart.
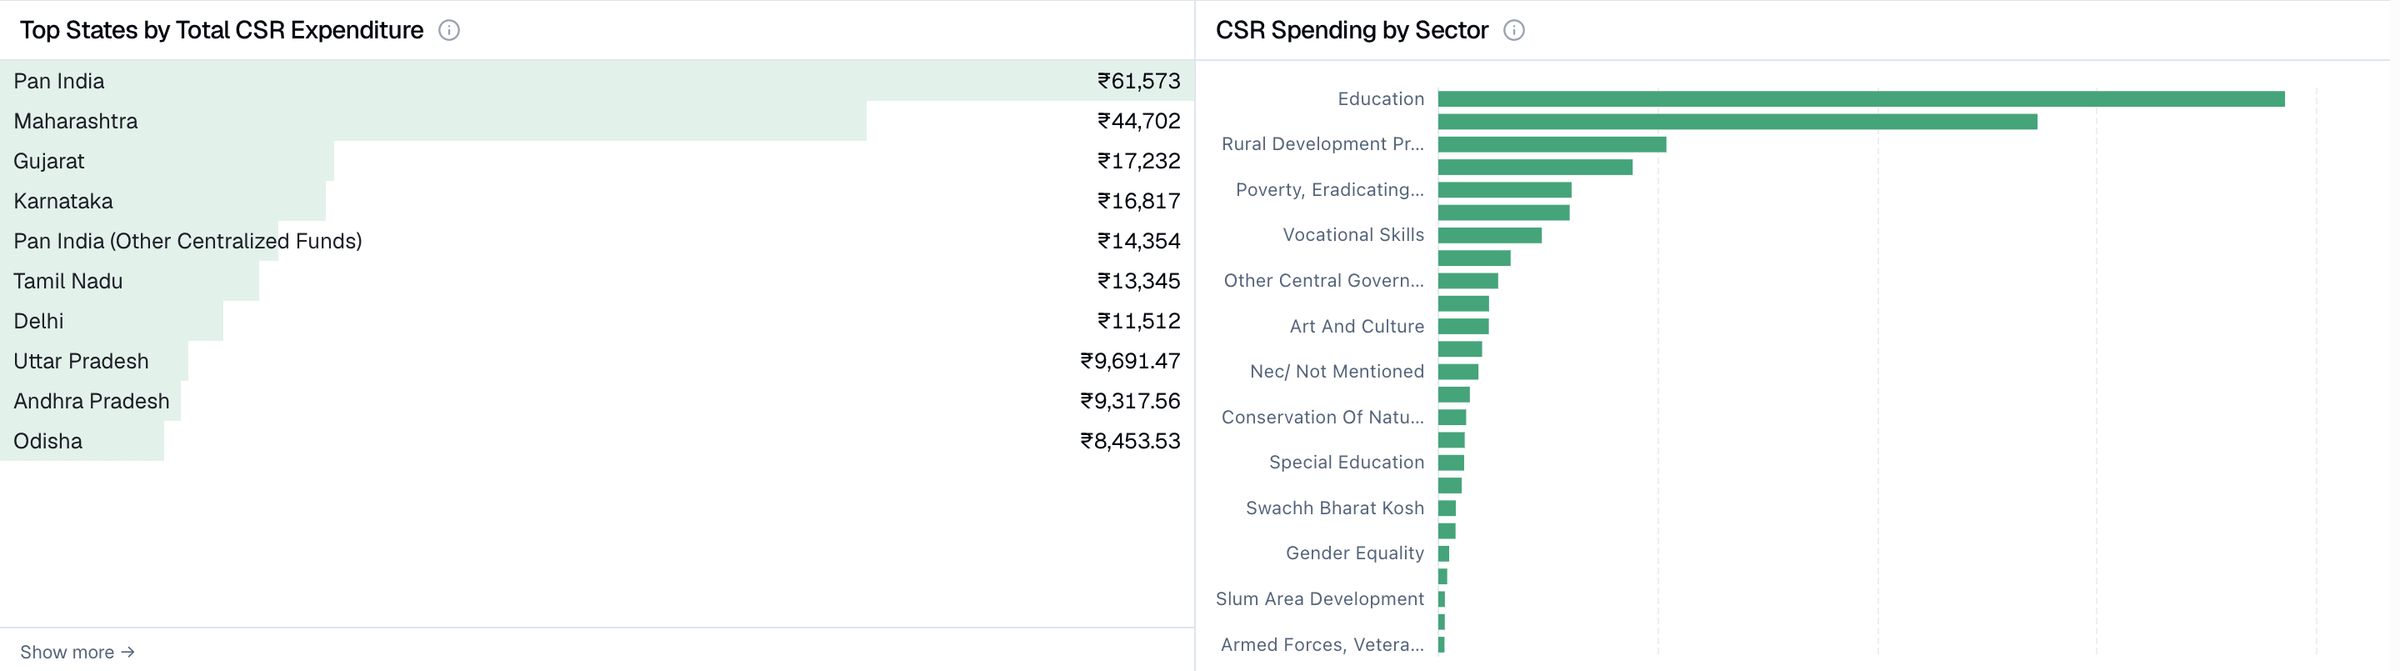
Fig. 4 A dashboard generated from one prompt. -
Step 5: Freeze a report
A state-wise report for 2024-25: executive summary, charts, tables; reviewed, then exported to PDF.

Fig. 5 A frozen, exportable narrative report. -
Output
A dashboard and a report from questions, every number traceable to a query, reviewed before it leaves the workspace.


§ 06 Evaluation
How we check it
-
The agent’s limits are documented: tool-call budget per turn, sampled results for large tables, refusal when the data cannot answer.
-
Security and privacy behaviour are published: what the model sees, how credentials are encrypted.
-
In production as the engine behind CSR Insights, BRSR Insights and StateStats.
§ 08 Limitations and lessons
Limitations and lessons
read this part first
Limitations
- Data-privacy behaviour depends on the model gateway you choose; we configure it with you.
- Generated dashboards can mislabel units or treat an aggregate as a category; review is part of the workflow.
- Some questions need the data reshaped first.
Lessons from operation
- Showing the SQL changed the conversation: non-technical users trust it, technical users check it.
- Documents belong next to the data. Most “wrong” answers are right answers to a mis-defined column.
- Cleaning at ingest and good dictionaries beat model changes.
Sources (12)
- [1] factly/gopie (AGPL-3.0) · github.com (opens external site)
- [2] GoPie: home · gopie.ai (opens external site)
- [3] GoPie documentation: integrations · gopie.ai (opens external site)
- [4] GoPie for public data · gopie.ai (opens external site)
- [5] GoPie documentation: how the agent works · gopie.ai (opens external site)
- [6] GoPie documentation: data cleaning · gopie.ai (opens external site)
- [7] GoPie documentation: reports · gopie.ai (opens external site)
- [8] GoPie documentation: MCP server · gopie.ai (opens external site)
- [9] GoPie documentation: AI data privacy · gopie.ai (opens external site)
- [10] GoPie documentation: security overview · gopie.ai (opens external site)
- [11] CSR Insights: home · csr.dataful.in (opens external site)
- [12] BRSR Insights: home · brsr.dataful.in (opens external site)
Sources reviewed 15 November 2026.
Discuss a project
Have tables and documents that should answer questions?
Tell us about the data, the documents that explain it and the report you rebuild every cycle.